
Oman Population 2018
4,806,026
Oman, officially the Sultanate of Oman, is an Arab state in southwest Asia on the coast of the Arabian Peninsula with a strategic position on the Persian Gulf. Oman is bordered by the United Arab Emirates, Saudi Arabia, and Yemen. In 2018, the estimated population of Oman is 4.83 million.
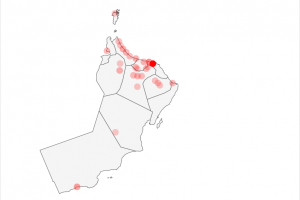
The estimated population of 4.83 million is a sharp increase over the 2010 census of 2.77 million. Nearly 50% of the population lives in Muscat and the Batinah coastal plain northwest of Muscat, while 200,000 live in the southern region. There are about 30,000 people in the remote Musandam Peninsula.
The largest city and capital is Muscat, with a population of around 800,000. This is followed by Seeb (240,000) and Salalah (165,000). Despite being the 70th largest country, Oman is one of the least densely populated with just 9 people per square kilometer (24/sq mi), which ranks 220th in the world.
Oman Population Pyramid 2018
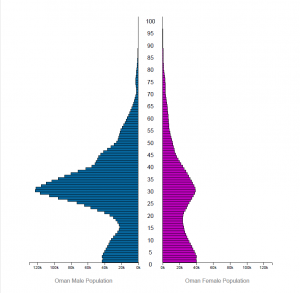
Oman Population Growth
Oman is currently experiencing the fastest population growth in at least fifty years and it has one of the fastest-growing populations in the world with a growth rate of more than 9% per year. From 2012 to 2013 alone, Oman added more than 227,000 people. This growth has been attributed to an increase in the birth rate and a decrease in deaths, partly due to an improving healthcare system.
Oman Population Density
Oman Top 20 Cities by Population
| Name | Population |
| Muscat | 797,000 |
| Seeb | 237,816 |
| Salalah | 163,140 |
| Bawshar | 159,487 |
| Sohar | 108,274 |
| As Suwayq | 107,143 |
| `Ibri | 101,640 |
| Saham | 89,327 |
| Barka’ | 81,647 |
| Rustaq | 79,383 |
| Al Buraymi | 73,670 |
| Nizwa | 72,076 |
| Sur | 71,152 |
| Bahla’ | 54,338 |
| Al Khaburah | 50,223 |
| Shinas | 48,009 |
| Sufalat Sama’il | 47,718 |
| Izki | 36,203 |
| Liwa | 26,372 |
| Ibra’ | 25,265 |
Oman Population by Year (Historical)
| Year | Population | % Male | % Female | Density (km²) | Population Rank | Growth Rate |
| 2018 | 4,829,946 | 66.19% | 33.81% | 15.61 | 124 | 4.18% |
| 2017 | 4,636,262 | 65.84% | 34.16% | 14.98 | 127 | 4.78% |
| 2016 | 4,424,762 | 65.39% | 34.61% | 14.30 | 127 | 5.36% |
| 2015 | 4,199,810 | 64.84% | 35.16% | 13.57 | 128 | 6.67% |
| 2010 | 3,041,460 | 60.32% | 39.68% | 9.83 | 136 | 3.91% |
| 2005 | 2,511,269 | 56.56% | 43.44% | 8.11 | 140 | 2.06% |
| 2000 | 2,267,991 | 56.14% | 43.86% | 7.33 | 141 | 0.57% |
| 1995 | 2,204,283 | 59.30% | 40.70% | 7.12 | 140 | 4.00% |
| 1990 | 1,812,160 | 55.66% | 44.34% | 5.86 | 144 | 3.88% |
| 1985 | 1,498,417 | 54.05% | 45.95% | 4.84 | 144 | 5.36% |
| 1980 | 1,154,379 | 52.70% | 47.30% | 3.73 | 145 | 5.53% |
| 1975 | 882,044 | 50.41% | 49.59% | 2.85 | 148 | 4.03% |
| 1970 | 723,852 | 49.13% | 50.87% | 2.34 | 148 | 2.98% |
| 1965 | 625,009 | 49.13% | 50.87% | 2.02 | 149 | 2.53% |
| 1960 | 551,740 | 49.53% | 50.47% | 1.78 | 150 | 2.16% |
| 1955 | 495,816 | 50.08% | 49.92% | 1.60 | 149 | 1.67% |
| 1950 | 456,419 | 50.76% | 49.24% | 1.47 | 150 | 0.00% |
Oman Population by Year (Projections)
| Year | Population | % Male | % Female | Density (km²) | Population Rank | Growth Rate |
| 2020 | 5,149,700 | 66.52% | 33.48% | 16.64 | 122 | 0.00% |
| 2025 | 5,572,149 | 65.91% | 34.09% | 18.00 | 122 | 1.59% |
| 2030 | 5,897,473 | 65.23% | 34.77% | 19.05 | 122 | 1.14% |
| 2035 | 6,128,590 | 64.47% | 35.53% | 19.80 | 121 | 0.77% |
| 2040 | 6,343,520 | 63.76% | 36.24% | 20.50 | 120 | 0.69% |
| 2045 | 6,549,888 | 63.07% | 36.93% | 21.16 | 120 | 0.64% |
| 2050 | 6,756,570 | 62.43% | 37.57% | 21.83 | 119 | 0.62% |
| 2055 | 6,923,098 | 61.82% | 38.18% | 22.37 | 119 | 0.49% |
| 2060 | 7,036,547 | 61.23% | 38.77% | 22.74 | 117 | 0.33% |
| 2065 | 7,095,546 | 60.65% | 39.35% | 22.93 | 117 | 0.17% |
| 2070 | 7,107,279 | 60.05% | 39.95% | 22.96 | 117 | 0.03% |
| 2075 | 7,079,876 | 59.41% | 40.59% | 22.88 | 117 | -0.08% |
| 2080 | 7,019,275 | 58.73% | 41.27% | 22.68 | 116 | -0.17% |
| 2085 | 6,930,314 | 58.01% | 41.99% | 22.39 | 116 | -0.25% |
| 2090 | 6,820,026 | 57.27% | 42.73% | 22.04 | 117 | -0.32% |
| 2095 | 6,698,449 | 56.54% | 43.46% | 21.64 | 118 | -0.36% |